

TensorBoard
AIOpen SourceFreeA suite of visualization tools to understand, debug, and optimize machine learning experiments and TensorFlow programs.
TensorBoard
A suite of visualization tools to understand, debug, and optimize machine learning experiments and TensorFlow programs.
About TensorBoard
TensorBoard is a visualization toolkit originally developed alongside TensorFlow to track, inspect, and debug machine learning experiments. It reads event logs (tfevents) and presents interactive dashboards for scalars, histograms, distributions, images, audio, embeddings, graphs, and profiling data, enabling real-time monitoring of training and model behavior. TensorBoard runs as a local or hosted web server (commonly on port 6006), supports modular plugins, and integrates with other platforms (e.g., Hugging Face Hub, PyTorch via tensorboardX or torch.utils.tensorboard) to visualize traces from multiple frameworks and share results. Its ability to compare runs, visualize model graphs and embeddings, and surface performance bottlenecks makes it valuable for experiment iteration and model debugging.
Screenshots
Key Features
Use Cases

Frequently asked questions about TensorBoard
Is TensorBoard free to use?
Yes, TensorBoard is completely free and open-source. Users can access its comprehensive toolkit without any licensing fees, making it an excellent choice for developers, researchers, and data scientists looking to visualize machine learning models and performance metrics.
Key Points
- TensorBoard is open-source and free to use.
- It provides powerful visualization tools for machine learning.
- Compatible with TensorFlow and other frameworks.
Detailed Explanation
TensorBoard is a visualization tool that helps users understand, debug, and optimize their machine learning models. As a part of the TensorFlow ecosystem, it allows users to visualize metrics such as loss and accuracy over time, and to inspect the model graph, histograms of weights, and more.
Key Features of TensorBoard:
- Scalars: Track key metrics over time to monitor training progress.
- Graphs: Visualize the computational graph of your model to understand its structure.
- Histograms: Analyze the distribution of weights and biases as training progresses.
- Images and Audio: View images and listen to audio samples processed by your model.
- Embeddings: Visualize high-dimensional data using techniques like t-SNE.
TensorBoard is not only free but also highly extensible. Developers can create custom plugins to extend its functionality, which further enhances its usability in various projects.
Best Practices / Tips
- Use Virtual Environments: Always run TensorBoard in a virtual environment to avoid conflicts with other packages.
- Log Regularly: Log metrics at regular intervals to get a clearer picture of your model’s performance over time.
- Explore Plugins: Consider using or developing custom plugins to tailor TensorBoard to your specific needs.
- Monitor Resource Usage: Keep an eye on resource usage when running TensorBoard, especially for large models or datasets.
Additional Resources
- TensorBoard Official Documentation
- Getting Started with TensorBoard
- Tutorials on TensorBoard Features
By leveraging TensorBoard’s free and robust toolkit, users can significantly enhance their machine learning workflows and improve model performance through effective visualization and monitoring.
What are the key features of TensorBoard?
TensorBoard is a powerful visualization tool for TensorFlow that includes key features such as model graph visualization, scalar tracking, profiling tools, an embedding projector, and a plugin architecture for extensibility. These features help developers analyze and optimize machine learning models effectively.
Key Points
- Model Graph Visualization: Understand model architecture at a glance.
- Scalars Tracking: Monitor metrics like loss and accuracy during training.
- Profiling Tools: Identify bottlenecks in model performance.
Detailed Explanation
Model Graph Visualization
TensorBoard allows users to visualize the structure of their machine learning models. This feature provides a graphical representation of the model architecture, helping developers understand the flow of data and operations within the network. For instance, you can see how layers are connected, which aids in debugging and optimizing models.
Scalars Tracking
With TensorBoard's scalars tracking, users can plot various metrics, such as training and validation loss, accuracy, and other performance indicators. This feature allows for real-time monitoring of these values as training progresses. By visualizing how these metrics change over time, developers can make informed decisions about adjustments to hyperparameters.
Profiling Tools
Profiling tools in TensorBoard enable users to analyze the computational performance of their models. This includes visualizations of time spent on each operation, memory usage, and other metrics that can highlight inefficiencies. By identifying bottlenecks, developers can optimize their models to achieve faster training times.
Embedding Projector
The embedding projector is another valuable feature, allowing users to visualize high-dimensional data like word embeddings or image features in a lower-dimensional space. This is particularly useful for understanding the relationships between data points and for interpreting the results of machine learning models.
Plugin Architecture for Extensibility
TensorBoard's plugin architecture allows developers to extend its functionalities by creating custom plugins. This flexibility means that users can tailor TensorBoard to their specific needs, whether it's integrating additional visualization tools or supporting different types of machine learning frameworks.
Best Practices / Tips
- Utilize Scalars Tracking: Regularly monitor scalars to avoid overfitting and underfitting.
- Take Advantage of Profiling: Use profiling tools to analyze performance and make necessary adjustments.
- Explore Plugins: Consider developing custom plugins if your project requires specialized visualizations.
Additional Resources
How do I get started with TensorBoard?
To get started with TensorBoard, install it via pip by running pip install tensorboard. Once installed, visualize your machine learning experiments by executing the command tensorboard --logdir <path_to_logs> in your terminal, specifying the path to your log files.
Key Points
- Install TensorBoard using pip.
- Launch TensorBoard with the log directory command.
- Monitor and visualize machine learning metrics effectively.
Detailed Explanation
TensorBoard is an essential tool for visualizing and analyzing your machine learning experiments. To begin:
-
Install TensorBoard: Open your terminal and run:
pip install tensorboardThis command downloads and installs the latest version of TensorBoard.
-
Prepare log files: Ensure your machine learning model is configured to write logs. If you're using TensorFlow, you can do this with the
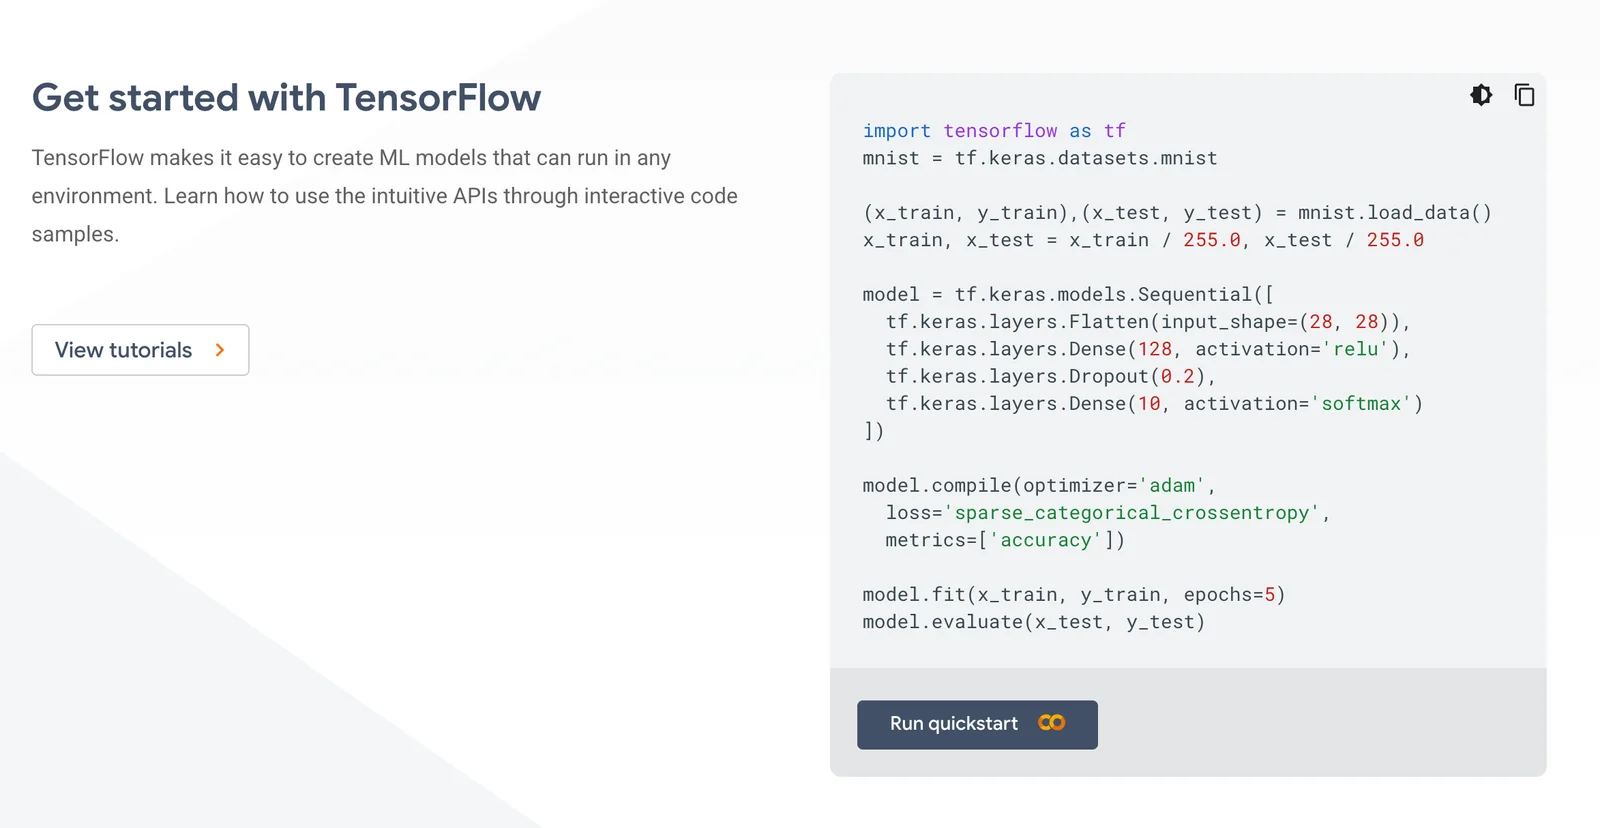
tf.summaryAPI. For instance:import tensorflow as tf # Create a summary writer log_dir = "logs/fit/" summary_writer = tf.summary.create_file_writer(log_dir) with summary_writer.as_default(): for step in range(100): tf.summary.scalar('my_metric', step * 0.1, step=step) -
Launch TensorBoard: Once your logs are generated, you can visualize them by running:
tensorboard --logdir logs/fit/Replace
logs/fit/with your actual log directory. After executing this command, TensorBoard will start a local server, typically accessible athttp://localhost:6006. -
Explore the UI: Open your web browser and navigate to the TensorBoard URL. You’ll see various tabs for Scalars, Graphs, Distributions, and Histograms, enabling you to analyze metrics, model graphs, and more.
Best Practices / Tips
- Organize Log Directories: Use meaningful names for log directories to easily identify different experiments, e.g.,
logs/experiment1/,logs/experiment2/. - Use TensorBoard Callback: If using Keras, consider utilizing the
TensorBoardcallback to automatically log metrics during training:tensorboard_callback = tf.keras.callbacks.TensorBoard(log_dir=log_dir, histogram_freq=1) model.fit(x_train, y_train, epochs=5, callbacks=[tensorboard_callback]) - Clear Logs Regularly: If you accumulate numerous log files, clear or archive older logs to avoid clutter and confusion.
Additional Resources
What integrations does TensorBoard support?
TensorBoard supports integrations with major frameworks like TensorFlow and PyTorch, as well as third-party platforms such as Hugging Face Hub, facilitating seamless experiment sharing and logging for machine learning projects. These integrations enhance the functionality and usability of TensorBoard across various applications.
Key Points
- TensorFlow Integration: The primary framework for TensorBoard.
- PyTorch Support: Allows users to visualize PyTorch models.
- Third-Party Platforms: Includes Hugging Face Hub for expanded capabilities.
Detailed Explanation
TensorBoard is a versatile tool primarily used for visualizing machine learning models and metrics. Its support for TensorFlow is foundational, as TensorBoard was developed alongside this framework. Users can easily log metrics, visualize training performance, and monitor model architecture through TensorFlow's native logging capabilities.
PyTorch Integration
With the rise of PyTorch, TensorBoard introduced native support for this framework as well. By utilizing the torch.utils.tensorboard package, PyTorch users can log scalars, images, histograms, and more, allowing them to leverage TensorBoard's visualization features. This integration is particularly beneficial for researchers and developers who prefer PyTorch’s dynamic computation graph.
Third-Party Platforms
TensorBoard’s integration with third-party platforms like Hugging Face Hub extends its utility significantly. By connecting TensorBoard with Hugging Face, users can share their experiments and models seamlessly, making collaboration easier. This is particularly useful in community-driven projects or when working in a team setting.
Best Practices / Tips
- Regular Logging: Ensure that you log metrics frequently throughout training to capture trends.
- Use TensorBoard.dev: For sharing your experiments publicly, consider using TensorBoard.dev, which allows for easy sharing of visualizations without needing to set up a server.
- Explore Plugins: Leverage existing plugins and community contributions to enhance your TensorBoard experience.
Additional Resources
How does TensorBoard compare to other ML visualization tools?
TensorBoard stands out among machine learning visualization tools due to its in-depth feature set, flexibility, and seamless integration with TensorFlow projects. While Weights & Biases and Neptune offer unique functionalities, TensorBoard is often preferred for its comprehensive visual analytics capabilities and ease of use in model training and debugging.
Key Points
- Integration with TensorFlow: TensorBoard is built into TensorFlow, providing a cohesive experience.
- Feature-Rich: It offers extensive visualization options, including scalar, histogram, and image data.
- Community Support: TensorBoard has strong community backing and extensive documentation.
Detailed Explanation
TensorBoard is specifically designed for TensorFlow, making it a go-to choice for developers working within this ecosystem. It provides a suite of visualization tools that help in tracking metrics such as loss and accuracy during training.
For instance, the scalar dashboard allows users to plot and monitor scalar metrics over time, while the embedding projector visualizes high-dimensional data, making it easier to understand complex datasets. This capability is crucial for tasks like analyzing word embeddings or image data.
In comparison, Weights & Biases excels in experiment tracking and collaboration, offering features like hyperparameter optimization and team dashboards. However, it may require additional integration steps with TensorFlow. Neptune is another alternative that focuses on experiment management and provides rich metadata tracking, but TensorBoard’s real-time monitoring capabilities often set it apart for immediate feedback during model training.
Best Practices / Tips
- Utilize Callbacks: Integrate TensorBoard callbacks in your training code to log metrics automatically.
- Organize Logs: Keep your logs well-organized by using distinct directories for different experiments to easily compare results.
- Frequent Monitoring: Regularly monitor your model’s performance in real-time to catch issues early in the training process.
Additional Resources
Explore more AI Ai Tools tools
Browse all Ai Tools tools →Compare TensorBoard: vs ReWeaver AI DriftDetector · vs Screenify Studio · vs Agnost AI · vs Assistly